


Shipping
Mapping our oceans:
how the Earth’s satellites power shipping
With the launch of a new generation of powerful satellites, marine observation data has vastly improved. Eva Grey finds out how ocean monitoring has improved over the decades, and how the data is used to improve shipping operations
Our seas and oceans
cover about 70% of our planet, providing subsistence for millions of people and spurring a wealth of trade, employment and social activity around the globe.
In Europe alone, if we count all economic activities that depend on the sea, the European Union's (EU) blue economy represents 5.4 million jobs and a gross added value of just under €500bn per year. In all, 75% of Europe’s external trade and 37% of trade within the EU is seaborne.
For coastal and developed states, an established, time-honoured seaborne trade plays a huge role in their economy; for least developed countries (LCDs), an emerging marine sector and the ecosystem of jobs it brings with it are crucial for relieving poverty and providing access.
Trying times of rapid population increase, climate change and economic instability means that now more than ever, policies and strategies that enable the sustainable growth of global shipping are needed. But how can policy-makers, researchers, scientists, tech manufacturers and the wider public keep informed of the current state of our oceans?
The vast majority of the marine data we use to guide, build, enhance and protect our ships has its origins in the small German city of Darmstadt, south of Frankfurt.
Darmstadt is home to the European Organisation for the Exploitation of Meteorological Satellites, or Eumetsat centre, the intragovernmental organisation that supplies all weather and climate-related satellite data, imagery and products to European states, as well as other meteorological services worldwide.
“We've been part of shipping for years and you haven't known it – and that's OK,” says Eumetsat training manager Mark Higgins. “To most of our users, we are 99% invisible; the data is just there. If we're doing a good job, people should be getting good, high-quality weather forecasts and we're just part of that.”
Container ship docking at port assisted by tugboat. Image courtesy of Ian Stewart / Shutterstock.com
Information from outer space
The field known as operational oceanography is concerned with delivering relevant and reliable information to citizens and decision-makers on the past, current and future state of the seas and oceans, at global, basin and coastal scales.
Satellites are crucial to operational oceanography, since their continuous, long-term global observations of the physical and biological state of the ocean and atmospheric parameters help dictate everything from marine weather forecasting, real-time ship re-routing, fuel efficiency planning, sea ice navigation, piracy and fishing.
At present, Eumetsat operates a total of nine satellites. The three Meteosat satellites, operating over Europe, Africa and the Indian Ocean, ensure that “not a single tropical storm or severe weather system goes undetected”. These are joined by three polar-orbiting Metop satellites, which, among other things, help inform on sea ice mapping for safe navigation.
The three remaining ones – Jason-2 and Jason-3, as well as the newest addition Sentinel-3A – contribute data to the Copernicus Marine Environment Monitoring Service (CMEMS), based in Toulouse, France.

The observations and forecasts produced as part of Copernicus support all marine applications
“The history of Earth observation has got to a point where there is a lot of information about the Earth's atmosphere, and marine environment and chemical composition,” Higgins says. “And over the last 15 to 20 years, the European Commission has been building up to the Copernicus programme. Its purpose is to enable European enterprises and institutions to provide much better environmental monitoring and decision-making.”
The observations and forecasts produced as part of Copernicus support all marine applications, from data on currents, winds and sea ice, offshore operations, or search and rescue operations.
“You have the information that's relevant for security: warnings about storms, huge waves or anything that can endanger the ship,” says François Montagner, Eumetsat Marine Applications manager. “The other main thing for shipping is up-to-date knowledge of currents, because ships these days try to take advantage of currents to save fuel on the route, or to shorten their route. Fisheries also use information from satellites, for example maps of sea surface temperature, the relative cold and warm areas, which for expert fishermen is useful information.”
“There's a lot of synergy in between these different applications because obviously oceans and atmosphere are very closely linked and one drives the other,” adds Hilary Wilson, Copernicus Sentinel-3 mission manager.

Image courtesy of
The Big Data challenge
Following the launch in early 2016 of the Jason-3 and Sentinel-3A satellites, the organisation is now able to provide an even broader range of data and imagery on ocean surface topography, sea surface temperature and ocean colour.
Sentinel-3A, the latest satellite in the range, monitors both land and sea and is made up of three components: an altimeter, measuring the sea surface height changes; an imager, which looks at sea surface temperature; and a third component that looks at ocean colour.
The data that gets sent, stored and processed at Eumetsat’s headquarters today has increased exponentially over the past decades, thanks to better quality imagery and improvements in computing power.
“Before Sentinel-3, the largest product that we would have was an average file of 2GB [of data] per orbit,” explains Wilson. “The largest product that we have today is around 50-60GB per orbit. That's a huge difference.”
To put this into context, just the commissioning stage of Sentinel-3A produced more data than all other Eumetsat satellites put together over a 20-year period of activity.
“We are indeed dealing with what everyone calls the Big Data challenge,” says Wilson.
NAVTOR uses sea ice and wind forecasting to guide around 3,000 vessels worldwide, including cruise ships

All this information is free for anyone to download and use as they please, and Wilson says they now have a bigger set of users who are taking the data and doing more creative and innovative things with it, as well as “starting to look into the synergy between fields”.
It has led to some useful and creative applications within shipping.
There’s the sailing navigation software SQUID, created by Belgian start-up Great Circle, which uses sea-surface temperature satellite data as well as ocean model currents to inform sailors of faster, more accurate and safer sailing routes.
Similarly, Norwegian shipping company NAVTOR uses sea ice and wind forecasting to guide around 3,000 vessels worldwide, including cruise ships. The data also allows for fuel savings and lower CO2 emissions.
The Spanish Port Authorities have also been using forecasts for the Bay of Biscay and the Irish Sea to inform port closures and avoid extreme weather, fight against oil spills inside the harbours, control water and air quality and inform pilot operations.
“There are also a lot of creative applications that get used for monitoring, for example, where debris in the ocean ends up,” Higgins says. “If there are plastics in the ocean, or a container that falls off the side of a ship, modelling can tell you where the debris from a particular place in the ocean will end up.”
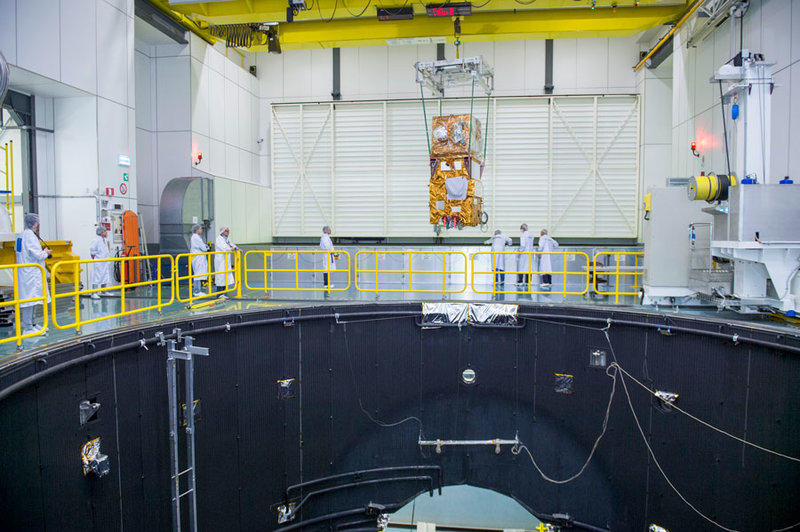
Image courtesy of
An unprecedented insight
Now, Eumetsat wants to provide an unprecedented level of insight into its ocean monitoring activities, as well as their challenges.
This ambition led to the launch of Monitoring the Oceans from Space, a free online course that follows the Sentinel-3, Sentinel-6 and Jason-3 satellites and explains their roles, as well as other marine missions such as Metop and Meteosat.
“We wanted to let the stories come out a bit so people can see how some of the economic, social, and policy decisions are made and fit together,” Higgins says.
Some operators have also raised concerns about a lack of training on offer to them by system manufacturers
“What we want to do through the online course is show end-to-end what the satellite data is for, and how can you trust the data. We targeted the course at people with more general scientific literacy, but more curiosity. If you like Blue Planet, you are the sort of person we were looking for. We tried to make it broadly available.”
The course is presented by Higgins, as well as physicist, oceanographer and broadcaster Dr Helen Czerski from University College London and remote sensing specialist Dr Hayley Evers-King from the Plymouth Marine Laboratory.
Covering everything from the world’s climate system, weather and hazard forecasting, ocean biodiversity, as well as international policy, the course is a journey of discovery into how satellite data can help shape and influence our lives, often in surprising ways.


